What does the cloud look like in 2011? What’s it made of? Thanks to a survey conducted by BitNami, Cloud.com and cloud management firm Zenoss, we have a fascinating new snapshot of the cloud market. With the help of 500 IT professionals, the companies were able to get a bead on some of the factors […]
Infographic of the day: Smart, Green Jobs
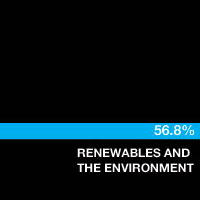
Today’s infographic comes from the Smart Jobs special report at Wired (click here to view the full version). And should provide America’s battered workforce some valuable insights. At 56.8 percent, the renewables and environment category saw the biggest percentage gains among seven million U.S. job hoppers on LinkedIn during the past five years. (On a […]
Infographic of the day: 1 data center = 25K homes
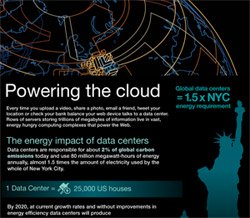
Cloud computing is taking the IT industry by storm but behind the technology are massive data centers that consume a lot of energy. How much? According to some of the opening stats in an infographic cooked up by ABB, a utility and industrial automation firm, the energy requirements of the world’s data centers are large […]
Infographic: Your home’s energy intensive ways
I love a good infographic in the morning. 1BOG’s pixelsmiths are at it again with a new infographic that illustrates how the American home has grown (literally and figuratively) to a big consumer of electricity. Did you know that by 2001, 86 percent of American households had microwaves compared to just 14 percent in 1980? […]
What if solar enjoyed Facebook-like adoption…
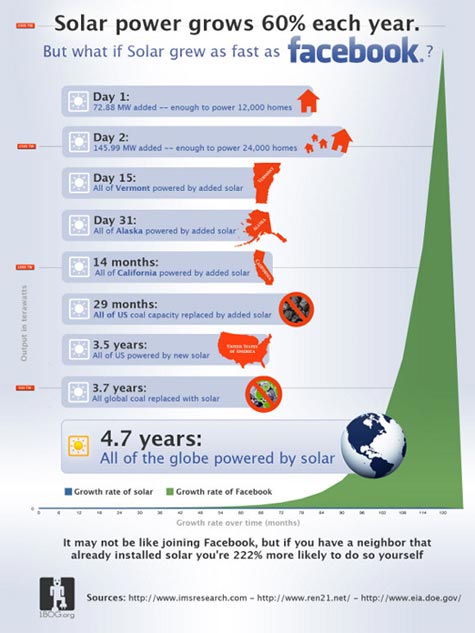
Infographic: One Block off the Grid (1BOG) has just posted a neat infographic that envisions what it would be like if solar panel installs followed the same trajectory as Facebook’s rate of adoption. Did you know that if that were the case, the U.S. could be completely powered by solar in just three and a […]


